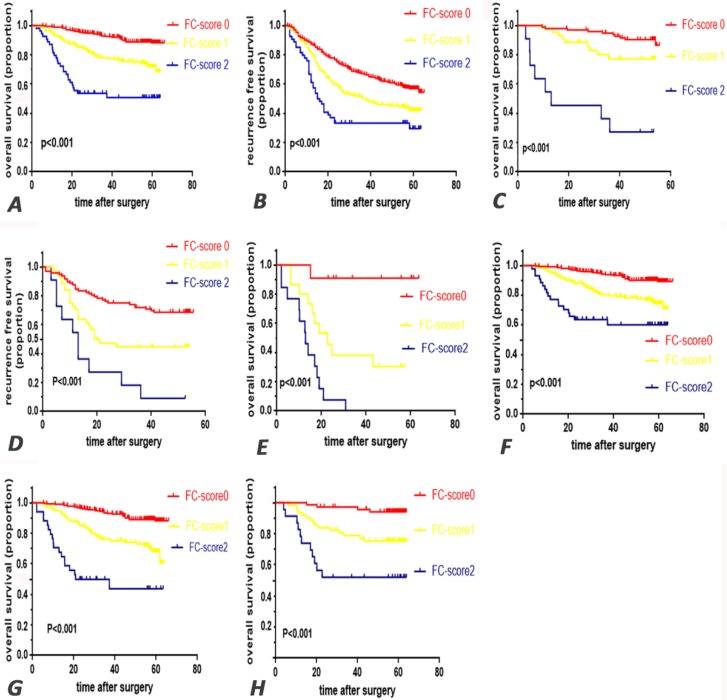
Figure 1.
Kaplan-Meier survival curves for patients in the research by FC-score. overall survival (AC) and recurrence free survival (BD) in training cohort and validation cohort respectively. Furthermore, in the subgroup analysis for OS, E survival curve for patients in the subgroup with tumor thrombus, F survival curve for patients without tumor thrombus. G survival curve for patients in the subgroup with hepatic cirrhosis, H for patients without hepatic cirrhosis. FC-score=fibrinogen and C-reactive protein score.

