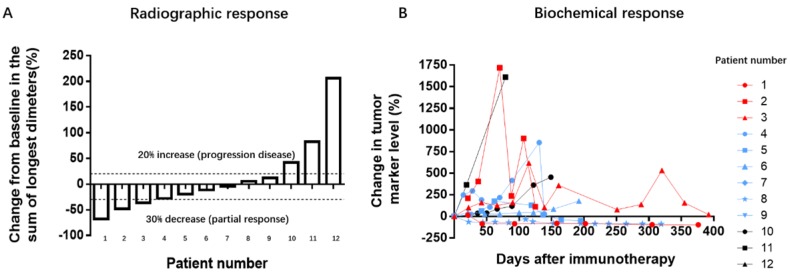
Figure 1.
Tumor responses on treatment with PD-1 antibodies. A: Radiographic responses evaluated based on response evaluation criteria in solid tumors (RECIST 1.1). The values shown are the largest percentage change in the sum of longest diameters from the baseline measurements of each measurable tumor. Each bar represents one patient. B: Serum levels of tumor biomarkers were measured at the start of each treatment cycle, and the values represent percentage changes from baseline. Each line represents 1 patient; patients with high baseline levels for tumor markers were included. Cytokeratin-19 fragments (CYFRA21-1) was used as the biomarker for 3 patients with non-small cell lung cancer, 1 with gastric cancer, and 1 with bladder cancer. Neuronal specific enolase (NSE) was used as a marker for 1 patient with small cell lung cancer. Carbohydrate antigens 125 (CA125) was used as a marker for 1 patient with a gastrointestinal stromal tumor. CA72-4 was used for 1 patient with laryngopharynx cancer. Alpha-fetal protein (AFP) was used as a marker for 1 patient with metastatic cancer. The other 3 patients had normal biomarker profiles during the treatment period.

