Figure 4.

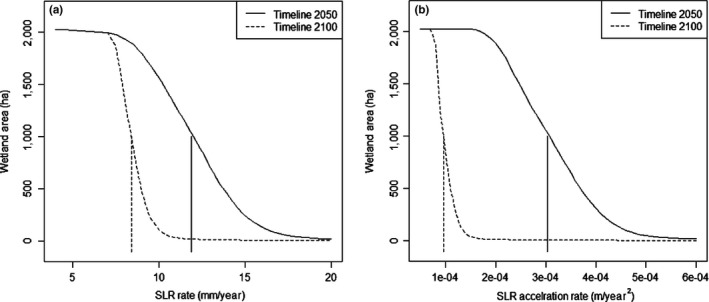
Coastal wetland area for 2050 and 2100 at different sea‐level rise (SLR) rates (a) and different SLR acceleration rates (b). The vertical lines showed the thresholds of SLR rate and SLR acceleration rate for 2050 and 2100, respectively

Coastal wetland area for 2050 and 2100 at different sea‐level rise (SLR) rates (a) and different SLR acceleration rates (b). The vertical lines showed the thresholds of SLR rate and SLR acceleration rate for 2050 and 2100, respectively