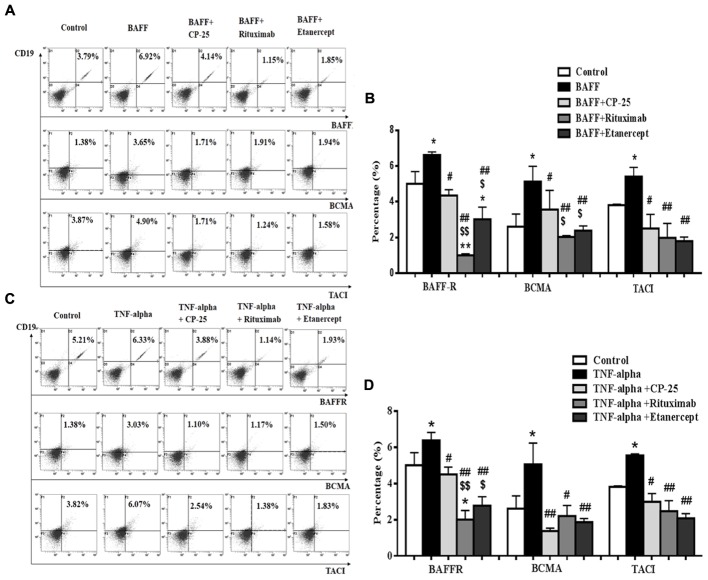
FIGURE 4.
The effects of CP-25 on BAFF receptors (BAFFR, BCMA, TACI) on B cells stimulated by BAFF and TNF-alpha. The expression of BAFFR, BCMA, and TACI is analyzed by flow cytometry. (A,C) The flow cytometry graphs are shown; (B,D) bar graphs show the percentage of BAFFR, BCMA, and TACI in different groups. The percentage is presented as mean ± SD (n = 5). ∗P < 0.05, ∗∗P < 0.01 versus control, #P < 0.05, ##P < 0.01 versus BAFF/TNF-alpha group, $P < 0.05, $$P < 0.01 versus CP-25 group.

