
Figure 9.
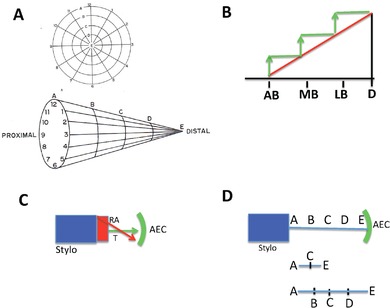
Models of distalization. (A) Polar coordinate model. Top, planar representation. The concentric circles (radial values) labeled A−E represent the PD positional identities generated by successive reiterations of centripetal migration and interaction. Numbers represent angular values. Bottom, the radial values telescoped out as each of the radial values is realized. (B) “Bootstrap” model. Red line, morphogen levels from proximal to distal. Green line, production of an AEC factor that increases morphogen levels in a proximal to distal direction. AB, accumulation blastema; MB, medium bud; LB, late bud; D, digits. (C) Regeneration of the segment of amputation (distal stylopodium, red), driven by a high level of RA (red arrow) that drops off distally to interact with a mitotic timing mechanism to specify remaining PD positional identities. (D) Intercalary averaging mechanism. Missing positional identities represented as A−E. The first step is intercalation of the intermediate positional identity; successive intercalations complete the PD sequence. (A) After French et al. (1976) and Bryant et al. (1981). (D) After Maden (1977)