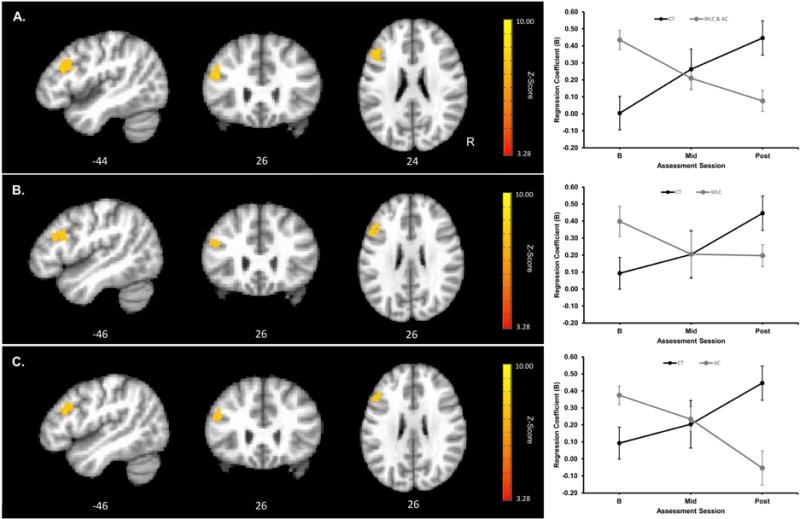
Figure 3.

Cluster showing significant Group × Assessment Session interaction contrast of RT-related parameter estimates and mean RT-related parameter estimates as a function of assessment session and group extracted from the peak voxel within the cluster (peak voxel MNI coordinates shown below the images). Upper panel (A) shows a significant cluster in left prefrontal cortex (PFC) for the CT versus combined WLC and AC group contrasts (k=210 voxels; cluster-wise α=.05 requiring k=82 voxels at a voxel-wise Z=3.28 and α=.001); middle panel (B) shows significant cluster in left PFC for the CT versus WLC group contrast (k=139 voxels; cluster-wise α=.05 requiring k=116 voxels at a voxel-wise Z=3.28 and α=.001); and lower panel (C) shows significant cluster in left PFC for the CT versus AC group contrast (k=126 voxels; cluster cluster-wise α=.05 requiring k=126 voxels at a voxel-wise Z=3.28 and α=.001). Image orientations are in neurological convention indicated with R=Right. Red to yellow indicates increasing strength of the Group × Assessment Session interaction contrast. For assessment session, BL=baseline, Mid=6 weeks into the training or waiting period, and Post=post-training or post-waiting period. Black=Cognitive Training (CT) group, gray=combined Wait Listed Control (WLC) and Active Control (AC) group in A, gray=WLC group in B, and gray=AC group in C. Errors bars show SEM.
