
Figure 1.
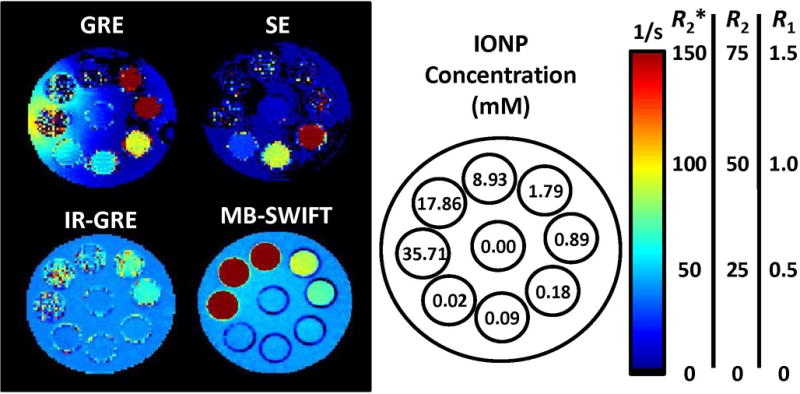
Comparison of relaxation rate maps for each of the pulse sequences. Within the GRE image, the impact of field inhomogeneity on the background saline of the phantom which is caused by the presence of IONPs is noticeable around the 35.71 mM sample. Additionally, the highest concentrations measured (> 8.93 mM) cannot be quantified with GRE. SE was observed to have a lower dynamic range than GRE. IR-GRE obtains similar measurements to SWIFT, however, the T2 and T2* effects impact the signal at higher IONP concentrations. SWIFT was able to detect the entire range imaged (0.02 to 35.71 mM).