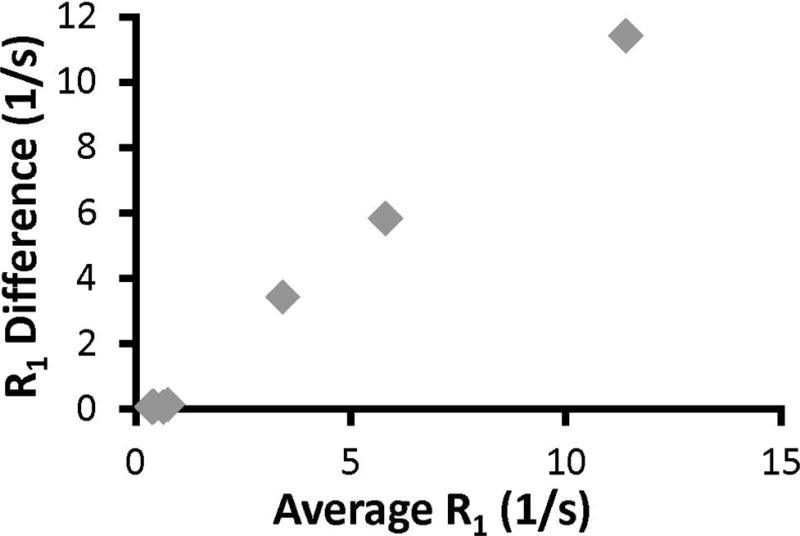
Figure 2.

A Bland-Altman plot comparing the gold-standard IR-GRE to SWIFT. The Bland-Altman plot demonstrates the difference between the measurement methods (y-axis) as a function of the changing R1 value (x-axis). If the two methods were identical, all points should be on the x-axis. IR-GRE is susceptible to T2 and T2* effects at high IONP concentrations, therefore, deviation between the two methods becomes noticeable at average R1 = 0.65 1/s (0.89 mM).
