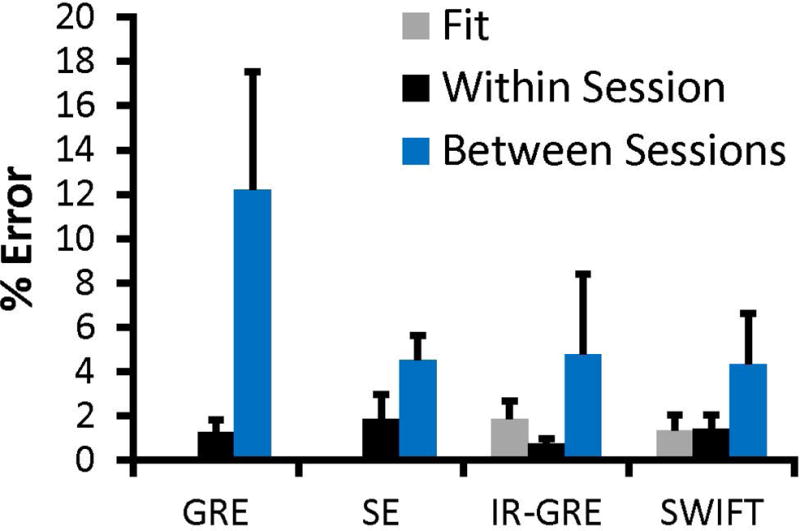
Figure 3.

Rx Error comparison. This error comparison shows the different sources of Rx error as a percentage of the Rx value. The error bars indicate the standard deviation of that percentage error across the detectable range. GRE, IR-GRE, and SWIFT were evaluated across the 0 – 1.79 mM dynamic range (n = 6), whereas SE is evaluated across its shortened dynamic range (0 – 0.18 mM; n = 4). “Fit” indicates the standard error due to the exponential fit. “Within Session” indicates the standard deviation across images acquired within the same session. “Between Sessions” indicates the standard deviation across during separate imaging sessions. The GRE and SE fit values are 0.00014% and 0.006%, respectively, and are not visible on the current plot.
