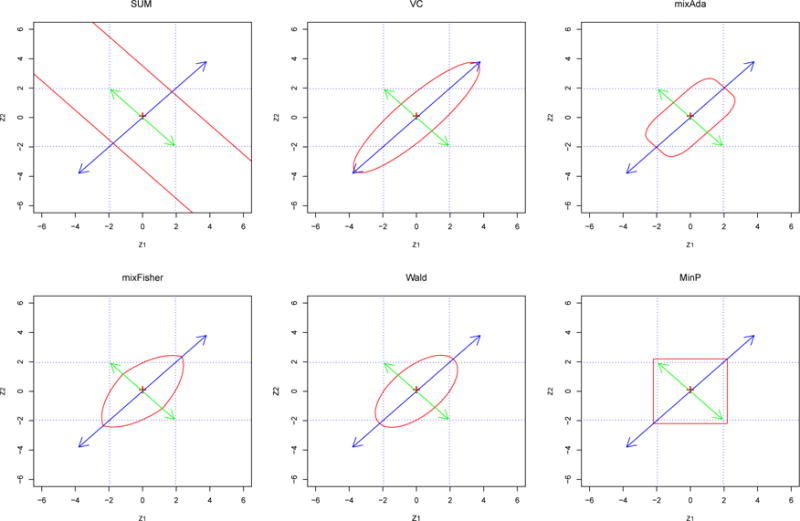
Figure 1.

The rejection boundaries (solid lines without arrows or curves) of the six tests (SUM, VC, mixAda, mixFisher, Wald and MinP) at the significance level 0.05 for a bivariate normal Z = (Z1, Z2)T with correlation ρ = 0.6 under the null. The longer solid lines with arrows represents the direction where Z has the largest variation and the shorter solid lines with arrows represents the direction (orthogonal to the longer solid lines) where Z has the second largest variation under the null. The dotted lines mark the univariate critical values at ±1.96 for Z1 and Z2 respectively. This figure appears in color in the electronic version of this article.
