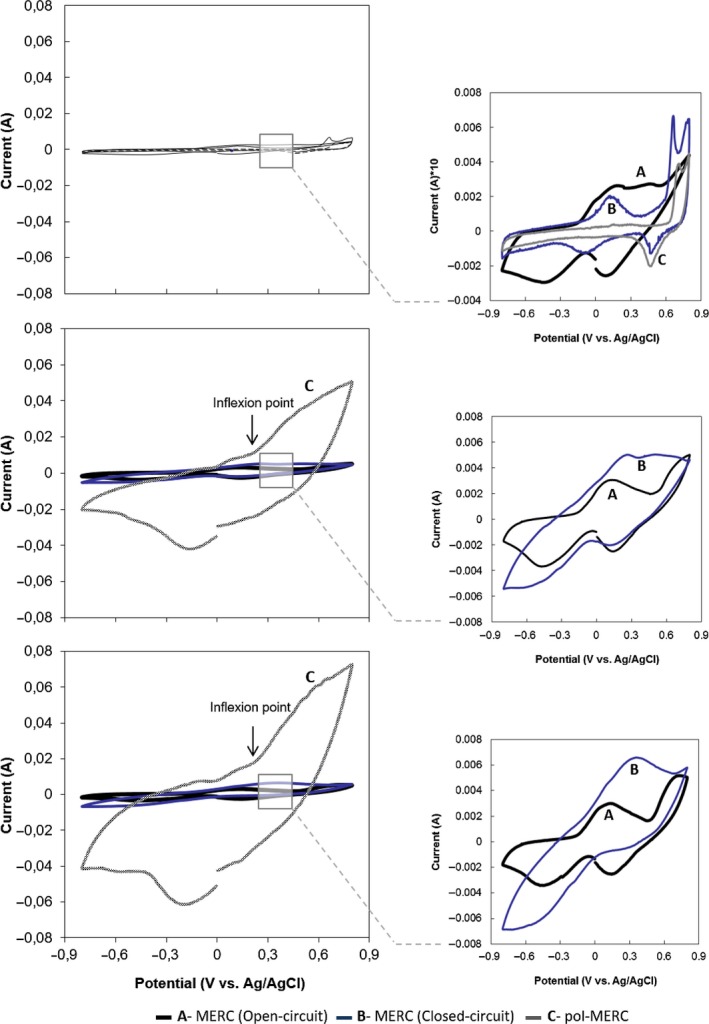
Figure 1.

Cyclic voltammetry analysis at different incubation periods (1, 7 and 20 days) for different configurations A. MERC (open‐circuit), B. MERC (closed‐circuit) and C. pol‐MERC. CVs were recorded at 1 mV s−1 from 0.8 and −0.8V and back to 0.8V (versus Ag/AgCl). The graphics at the right column focus closely on the voltammetries.
