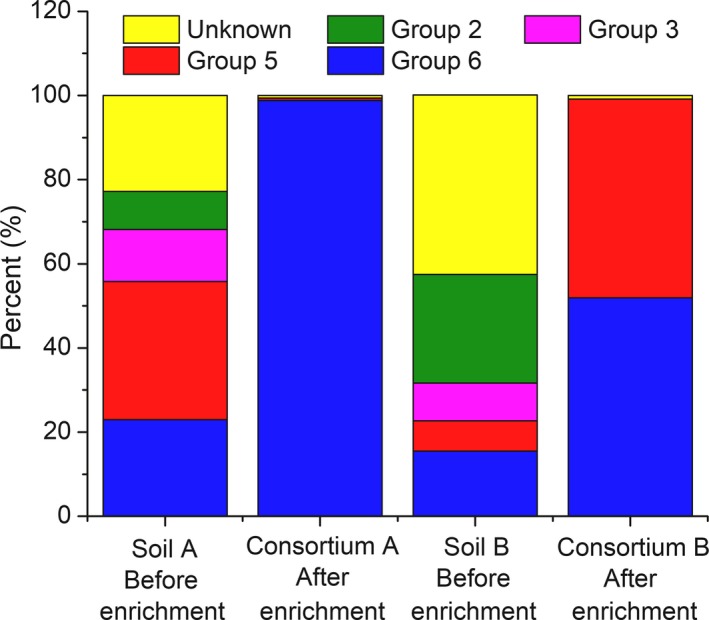
Figure 4.

SDIMO gene sequencing of nested PCR products from the original soil samples and enriched consortia. ‘Group 2′, ‘Group 3′, ‘Group 5′ and ‘Group 6′ indicate a high similarity (> 93%) with groups 2, 3, 5 and 6 soluble di‐iron monooxygenase hydroxylase (SDIMOs) alpha subunit genes respectively. ‘Unknown’ indicates no significant similarities with any SDIMO gene sequences available on NCBI. The percentages bars represent the fractions of different SDIMO gene groups in the two consortia. These sequence data were submitted to the GenBank database under accession number SRP103872.
