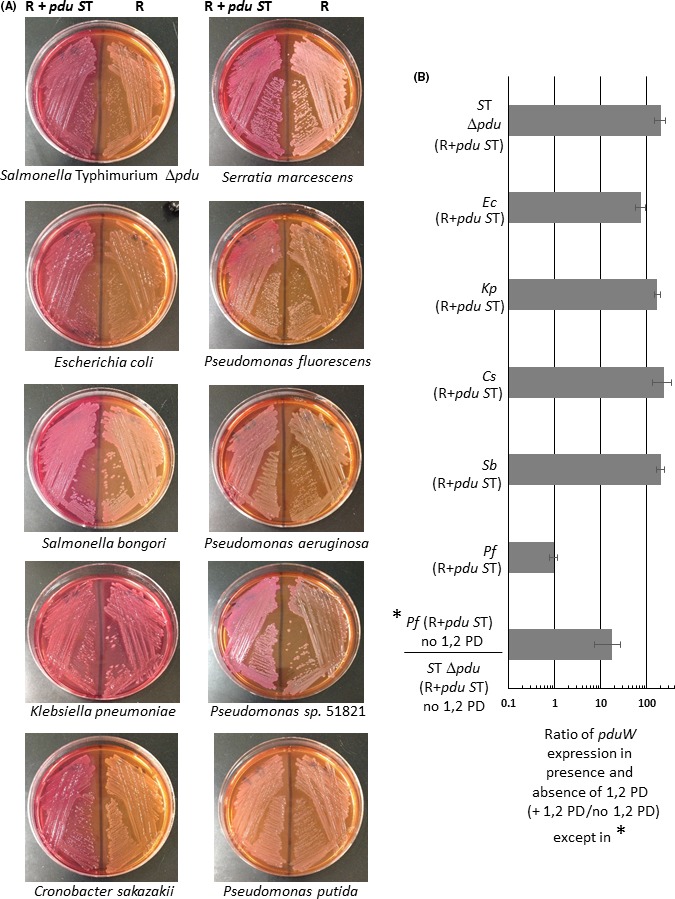
Figure 2.

Expression analysis of pdu genes from R995 + pdu ST. Panel A: The indicated bacterial species containing either R995 + pdu ST or the R995 vector control were streaked onto MacConkey medium supplemented with 1,2 PD and coenzyme B12. Utilization of 1,2 PD will result in a pink/red colony colour on this medium. Panel B: RT‐qPCR analysis of pdu gene expression from R995 + pdu ST is shown. The indicated bacterial species containing R995 + pdu ST were grown in the presence or absence of 1,2 PD, and the total RNA was harvested for each sample. The RNA was converted to cDNA and then used as template in qPCR analysis with primers targeting the pduW or korB genes (the latter being a gene present on the R995 vector backbone). The qPCR product levels were normalized to the level of the korB gene, and a ratio of pduW levels in the presence and absence of 1,2 PD was calculated to give a fold difference in expression between the two growth conditions. Species abbreviations correspond to those in the Fig. 1 legend.
