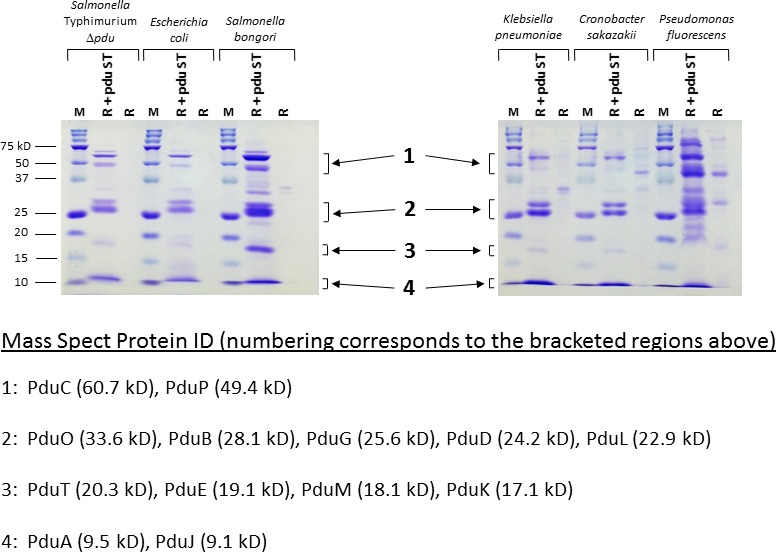
Figure 3.

SDS‐PAGE analysis of isolated MCPs from R995 + pdu ST strains. The indicated strains containing either R995 + pdu ST or the R995 vector were grown in Pdu medium, and the MCPs were isolated from the cultures as described in Experimental Procedures. An aliquot of each MCP prep (corresponding to approximately 7–15 μg protein for the R995 + pdu ST preps) was run via SDS‐PAGE and stained with Coomassie Blue. ‘M’ stands for the protein marker (BioRad Precision Plus Kaleidoscope, 15 μg loaded). Protein band locations indicated by the numbered brackets were excised from R995 + pdu ST samples and subjected to Nano‐LC‐MS/MS mass spectrometry analysis. The protein IDs obtained from mass spectrometry analysis of samples cut from gels at the approximate indicated locations are provided as noted.
