Figure 4.

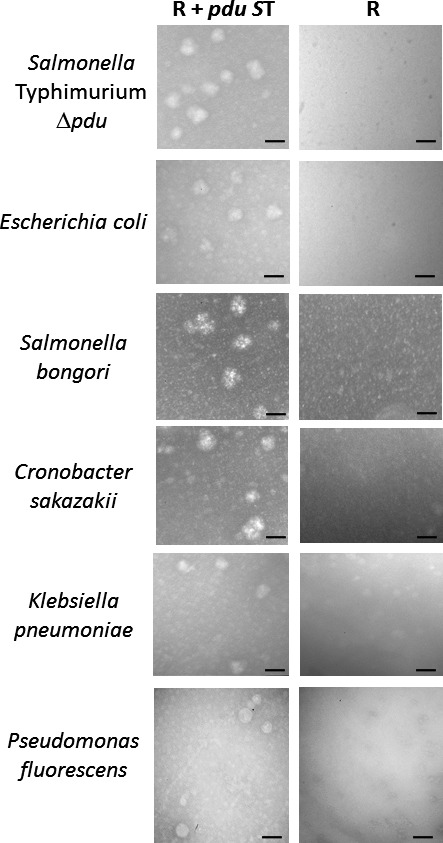
Transmission electron microscopy analysis of isolated MCPs. Samples from the indicated MCP preps were stained with 4% uranyl acetate and visualized using TEM. The size bar in each micrograph corresponds to 100 nm.

Transmission electron microscopy analysis of isolated MCPs. Samples from the indicated MCP preps were stained with 4% uranyl acetate and visualized using TEM. The size bar in each micrograph corresponds to 100 nm.