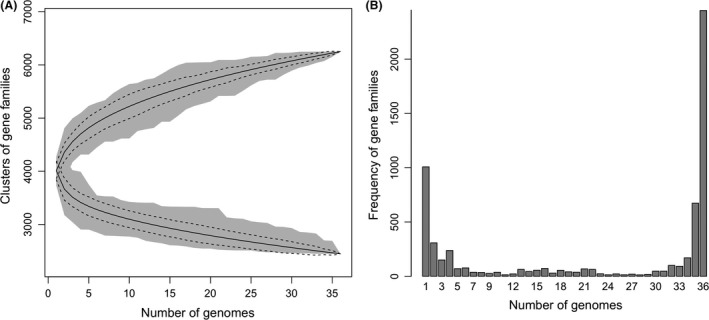
Figure 3.

Analysis of protein‐coding genes in 36 complete genomes of B. subtilis.A. The core and pan‐genomes were computed for random samples of increasing size of the 36 genomes. The shaded regions indicate the range of variation of these values.B. The frequency of the presence of each gene family from those that are present in only one strain (peak at 1) to those that are components of the core genome (peak at 36). The identification of the families of core and pan‐genomes followed the methodology of (Touchon et al., 2014).
