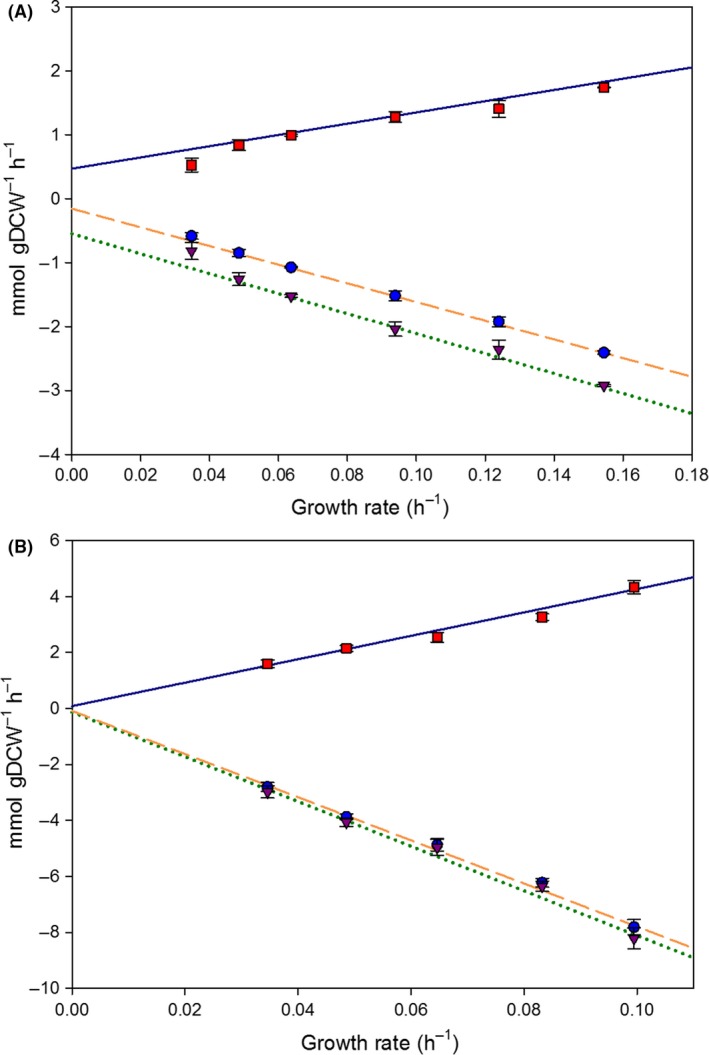
Figure 4.

Evaluation of simulated and experimental macroscopic variables for the growth in glycerol and methanol. For each carbon source, the growth rate was constrained, and the absolute value of substrate uptake rate was minimized.
A. Chemostats on glycerol.
B. Chemostats on methanol.
qS , glycerol/methanol (●), qCO 2 (■), qO 2 (▼); predicted qS , glycerol/methanol (dashed line), predicted qCO 2 (continuous line), predicted qO 2 (dotted line).
