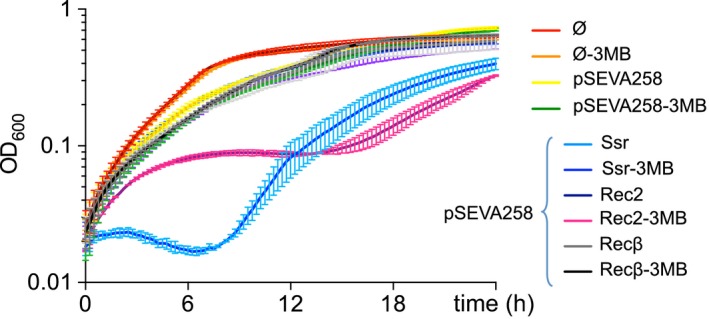
Figure 3.

Liquid growth profiles demonstrate slight toxicity of the Rec2 protein. To measure the effects of protein toxicity on cell growth, curves were generated for 3MB‐induced and non‐induced experimental strains using a Spectramax M2e Microplate Reader (Molecular Devices). We prepared overnight LB‐Km cultures of Pseudomonas putida EM42 strains containing pSEVA258‐rec2, pSEVA258‐ssr and pSEVA258‐recβ, as well as EM42/pSEVA258 and EM42 controls. Overnight cultures were back‐diluted in LB‐Km with and without 3MB inducer to an initial OD 600 = 0.05 before being loaded into a 96‐well microtiter plate. Liquid growth profiles of 1 mM 3MB‐induced (t = 0) and non‐induced strains were measured over a 24 h period (interval t = 15 min). Time elapsed (h) is shown on the x‐axis, while optical density at 600 nm (OD 600) is shown on the y‐axis. Strain type is indicated in the figure legend. Individual points represent mean values, and horizontal brackets indicate SE calculated from two independent experimental replicates.
