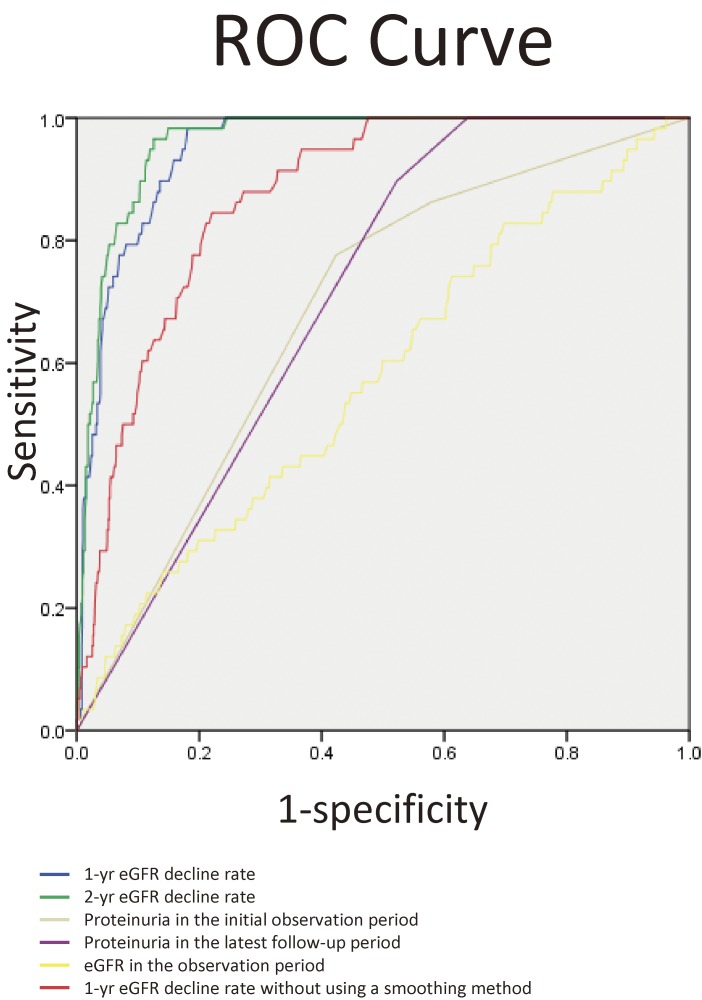
Figure 3.
ROC curves of different prediction markers for 50% decline in estimated glomerular filtration rate prediction. The AUC of 1-year eGFR decline rate was 0.949 (95% CI: 0.932–0.966). The AUC of 2-year eGFR decline rate was 0.961 (95% CI: 0.947–0.975). The AUC of albuminuria in the initial 2-year observation period was 0.684 (95% CI: 0.620–0.748). The AUC of albuminuria in the last observation period was 0.706 (95% CI: 0.657–0.755). The AUC of mean eGFR in the initial 2-year observation period was 0.576 (95% CI: 0.500–0.652).

