Figure 3.
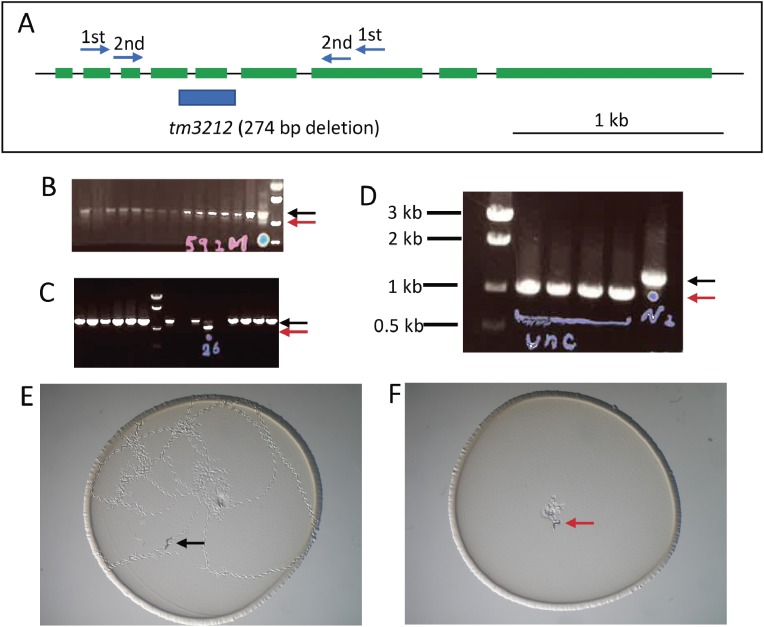
An example of mutant isolation and phenotyping. (A) A set of nested primers for a gene (unc-18) was designed to span exons. The deletion site of an isolated mutant allele (blue bar) is shown under the gene structure (green: exons). (B) An example of PCR screening and agarose gel electrophoresis. Wild-type bands are shown by a black arrow, while a faint mutant band of a shorter size is seen (a red arrow in the lane with a blue dot). Frozen stocks for candidates were thawed and cultured in individual culture dishes and then again examined by PCR after laying eggs (C). Both the wild-type band (black arrow) and the mutant band (red arrow) are observed in a lane, indicated that the animal was heterozygous. Hatched worms from the culture above were again singled to individual dishes and analyzed again (D) and all the animals showing the Unc phenotype have only mutant bands (red arrow) in contrast to control wild-type (N2) band (black arrow). Phenotype observation of wild-type (E) and unc-18 mutant (F) animals placed at the center of the dishes and left for an hour. Only wild-type animals moved around on the bacterial lawn.

