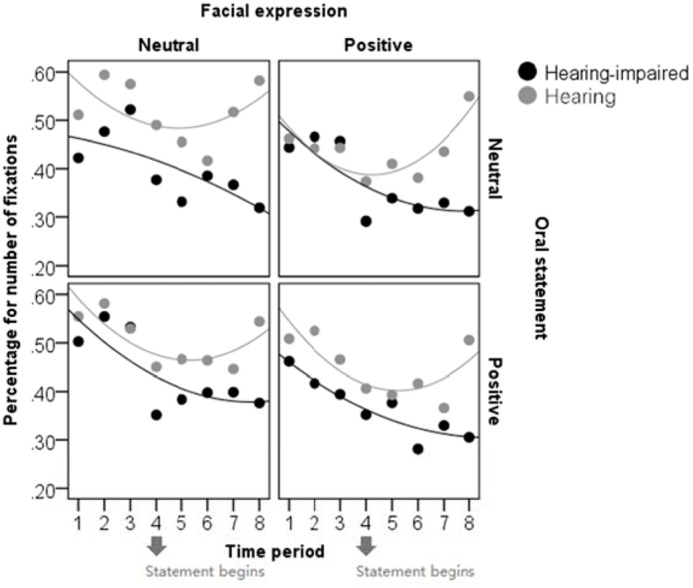
FIGURE 3.

The scatter plots between time period and percentage for number of fixations in each condition. The abscissa (X axis) presents eight time periods with 1.5 s for each one. The ordinate (Y axis) presents the quotient of the fixation number within the upper part of the face divided by the total fixation number on the stimuli.
