Figure 4.
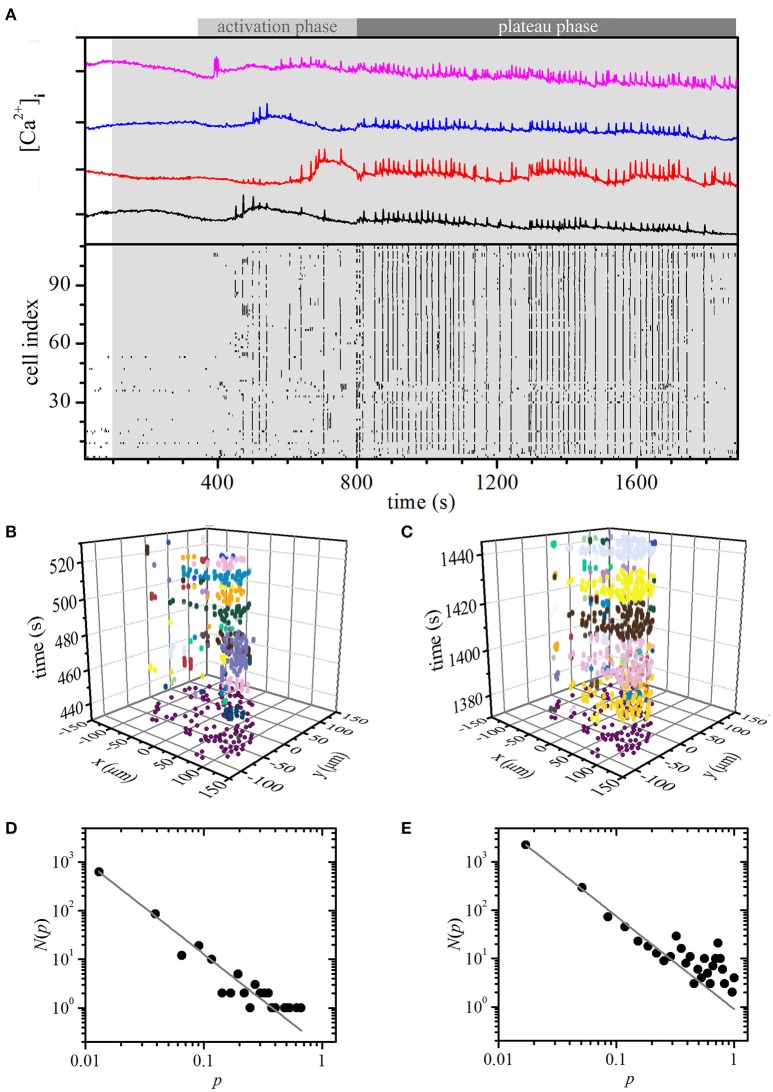
Experimental constant stimulation: spatiotemporal organization of intercellular [Ca2+]c waves in islets. (A) [Ca2+]i responses of four typical cells within an islet to stimulation with 8 mM glucose (upper panel). Binarized oscillations for all cells within the same islet (lower panel). The gray shaded area indicates the switch from 6 to 8 mM glucose. Space-time clusters of [Ca2+]i activity in the activation phase (B; 300 s < t < 800 s) and in the plateau phase (C; t > 800), the colors denote different [Ca2+]i waves. The distributions N(p) of relative spatiotemporal [Ca2+]i wave sizes p for the activation phase (D) and in the plateau regime (E). The gray line indicates a power-law fit with slopes −1.82 and −1.92 for the activation and plateau phase, respectively.

