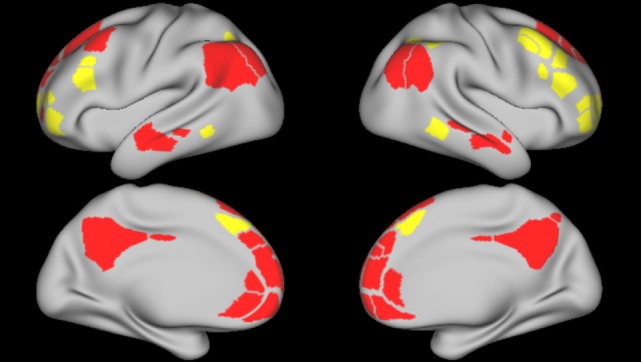
Figure 2.

Frontoparietal and default mode network parcels. Figure depicts the frontoparietal network (yellow) and the default mode network (red) parcels, derived from boundary-map parcelation [Gordon et al. (27)]. Top images represent the left and right lateral brain surfaces, respectively. Bottom images represent the left and right medial brain surfaces. The same cortical parcels were used in both control and schizophrenia participants.
