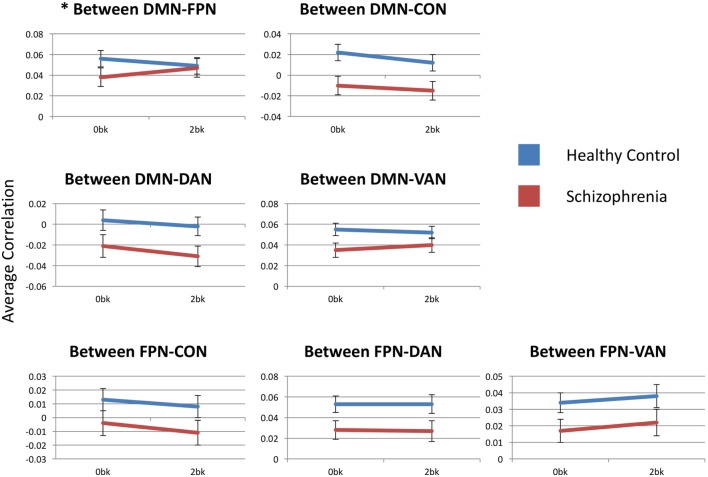
Figure 4.
Between-network functional connectivity across group and condition. Each graph presents the average between-network correlation coefficients (y-axis) for each of the seven tested connections. DMN, default mode network; FPN, frontoparietal network; CON, cingulo-opercular network; DAN, dorsal attention network; VAN, ventral attention network. Asterisks indicate statistical significance (p = 0.05) for group × condition effect. Error bars represent SEs.

