
FIGURE 3.
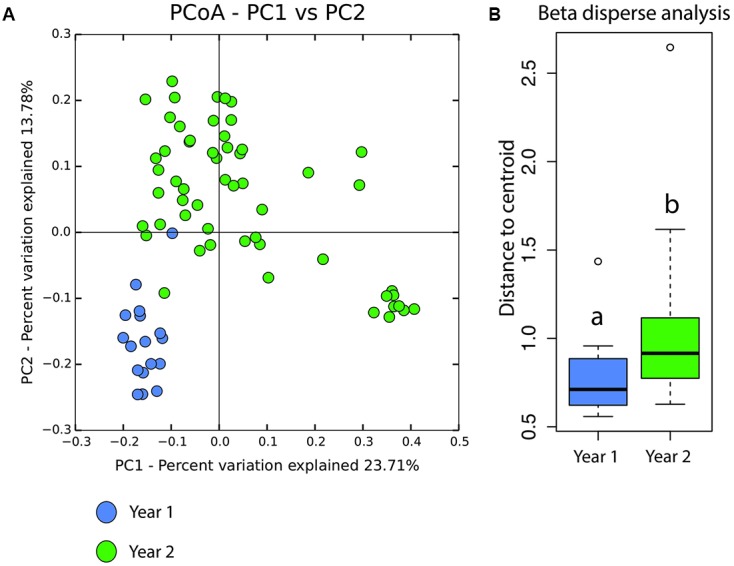
(A) Beta diversity of P. loveridgei between year 1 (blue) and year 2 (green). Principal coordinate analysis is based on weighted Unifrac distances [ADONIS F(1,71) = 5.8841, P = 0.001]. (B) Analysis of multivariate homogeneity of group dispersions (variance) of P. loveridgei skin microbial communities. Box plot of distances to each centroid’s group. Different letters (a and b) signify statistically significant differences between year 1 and year 2 [ANOVA F(1,70) = 5.9827, P = 0.01696].