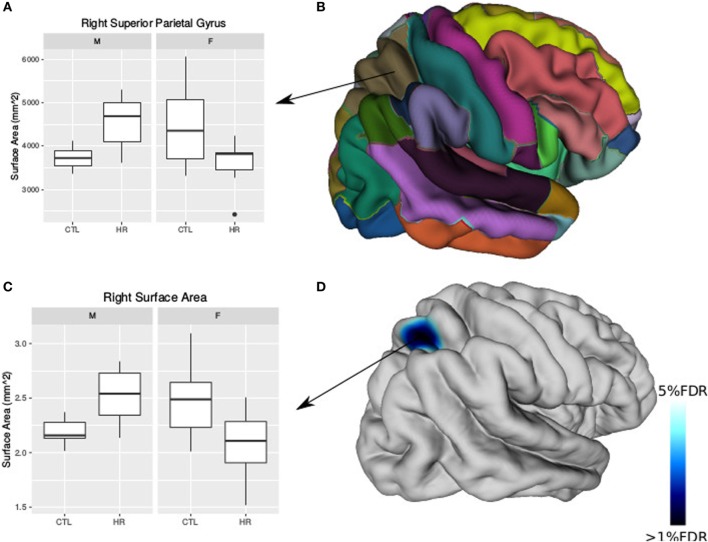
Figure 3.
Sex differences in surface area (SA) in individuals at clinical high risk and healthy controls. (A) Boxplot representing significant sex-by-diagnosis interaction in the right superior parietal gyrus SA. (B) Automated anatomical labeling cortical parcelation of right hemisphere. (C) Boxplot of peak vertex representing significant sex-by-diagnosis interaction on cortical SA [<5% false discovery rate (FDR)]. (D) Cortical representation of significant sex-by-diagnosis interaction for SA with blue column representing t-values above the 5% FDR threshold mapped onto the average cortical surface.

