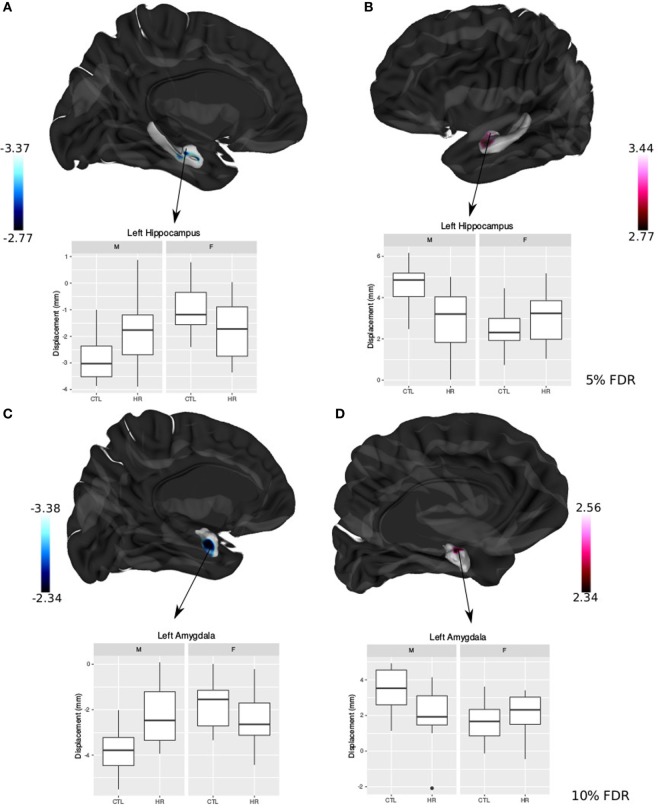
Figure 4.
Sex differences in hippocampal shape and amygdala shape. (A,B) Significant sex-by-diagnosis interaction for left hippocampus displacement measures; t-statistics overlaid on group average hippocampus surface [<5% false discovery rate (FDR)]. (C,D) Significant sex-by-diagnosis interaction for left amygdala displacement measure in the lateral amygdala; t-statistics overlaid on group average amygdala surface (<10% FDR). In blue, there is inward displacement of females at clinical high risk (CHR) relative to CTL females, and outward displacement of CHR males relative to CTL males. In pink, the opposite is found, with inward displacement of CHR males relative to CLT males, and outward displacement of CHR females relative to CTL. All boxplots represent displacement values of peak voxel. Color bar denotes t-statistics with more significant values in darker shades.

