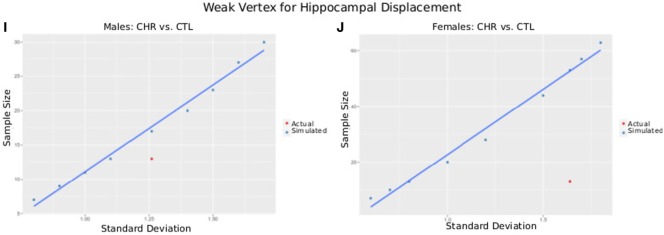
Figure 6.
Plots of SD versus required sample size for power = 0.8 and α = 0.05. Using either the peak vertex or mean cortical thickness (CT) values, we calculate the sample size that would be required to obtain 80% power given α = 0.05 and a variety of SDs. These are plotted in blue as simulated data. In red, we plot the actual SD for each result versus the sample size of each group [clinical high-risk (CHR) male = 13, CTL male = 15, CHR female = 13, CTL female = 14], allowing a comparison of our sample size versus the sample size required to measure the effect. (A,B) Plots show data from CT of the left superior parietal gyrus of male subjects (A), where CHR males had thicker cortex than CTL males, and female subjects (B), where CHR females had thinner cortex than CTL females. (C,D) Plots show data from CT of the right superior temporal gyrus (a region in which we did not observe group by sex interactions) of male subjects (C) and female subjects (D) comparing CTL with CHR. (E,F) Plots show data from CT of the left parahippocampal gyrus (a region in which we did not observe group by sex interactions) of male subjects (E) and female subjects (F) comparing CTL with CHR. (G,H) Plots show data from the peak vertex for left hippocampal displacement for male subjects (G), and female subjects (H), where significant sex-by-group interactions were observed. (I,J) Plots show data from a weak vertex (i.e., where the group × sex interaction was weaker) for left hippocampal displacement for male subjects (G), and female subjects (H), where significant sex-by-group interactions were observed. Overall (A–I) give confidence that the sample size of our study is sufficient to observe the reported effects in male subjects, but that we may be slightly underpowered for the females. Further, we may have been underpowered to detect group differences in other regions of interest (C–F).


