
FIGURE 2.
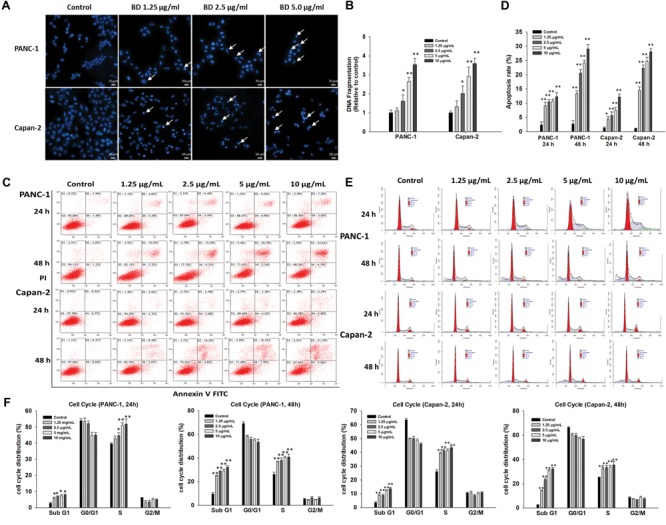
BD elicits apoptosis and S-phase arrest in PANC-1 and Capan-2 cells. (A) PANC-1 and Capan-2 cells were subjected to cell nucleus morphological analysis using Hoechst 33342 after different concentrations of BD (1.25, 2.5, and 5 μg/mL) treatments for 48 h. Representative fluorescence images of Hoechst 33342 positive cells are shown. Scale bar, 20 μm. (B) Cells were treated with various concentrations of BD (1.25, 2.5, 5, and 10 μg/mL) for 72 h, followed by Cell Death Detection ELISA assay. (C,D) Cells were exposed to different concentrations of BD (1.25, 2.5, 5, and 10 μg/mL) for 24 and 48 h, followed by flow cytometry apoptosis assay. Bar graphs show the proportion of early and late apoptotic cells. (E,F) Cells were treated with BD (1.25, 2.5, 5, and 10 μg/mL) for 24 and 48 h, and the cell cycle phases were evaluated by flow cytometry. Each bar represents means ± SD of three separate experiments. ∗P < 0.05 and ∗∗P < 0.01 vs the control group.