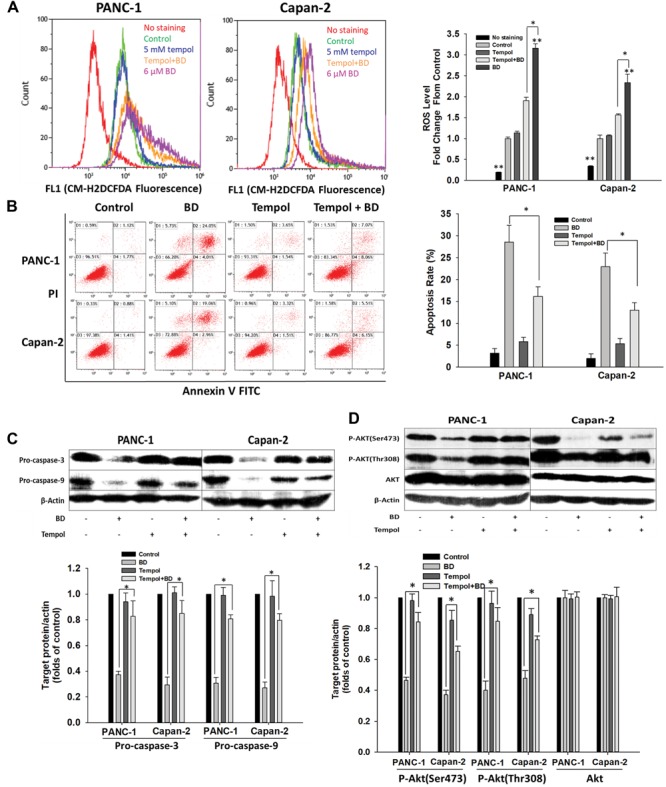
FIGURE 5.

Brucein D-mediated apoptosis involves ROS generation. (A) Representative flow cytometry histograms showing the relative content of ROS after pretreatment with tempol (5 mM) for 2 h, followed by 12 μM BD treatment for 24 h. Data are expressed as fold changes in CM-H2DCFDA fluorescent levels of the treated cells to the non-treated cells (Control). (B) Flow cytometric analysis was carried out by Annexin V-FITC and PI double-staining after pretreatment with tempol (5 mM) for 2 h, followed by 12 μM BD treatment for 48 h. (C) Protein lysates of the cells either pretreated with 5 mM tempol for 2 h or left alone followed by BD treatment for 24 h were analyzed by Western blotting. β-Actin served as the loading control. (D) Cells were either pretreated with 5 mM tempol for 2 h or left alone followed by BD treatment for 24 h. The expression of Akt and p-Akt was analyzed by Western blotting. β-Actin served as the loading control. Each bar represents means ± SD of three separate experiments. ∗P < 0.05 and ∗∗P < 0.01 vs the control group.
