
FIGURE 6.
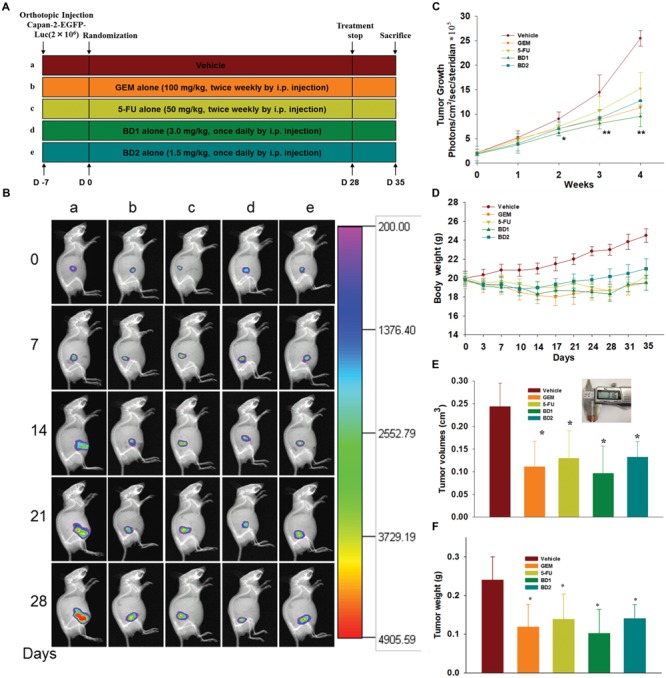
BD inhibits the tumor progression in orthotopic xenograft mouse model. (A) Schematic depiction of the experimental schedule as presented in section “Materials and Methods” (n = 8). (B) Bioluminescence In-Vivo FX PRO images of orthotopically implanted Capan-2 cells in live, anesthetized mice under different treatment regimens every week. (C) Determination of photons per second showing the tumor volume at different time points by live bioluminescence imaging. (D) Body weight alternations of mice were determined at the indicated time. (E) Tumor volumes in mice were determined at autopsy with vernier calipers and calculated following the formula V = 4/3π(a/2∗b/2∗c/2) (n = 8). (F) Average tumor weight of each group on the last day of the experiment. Each column represents the mean ± SD of eight samples. ∗P < 0.05 and ∗∗P < 0.01 vs. the control group.