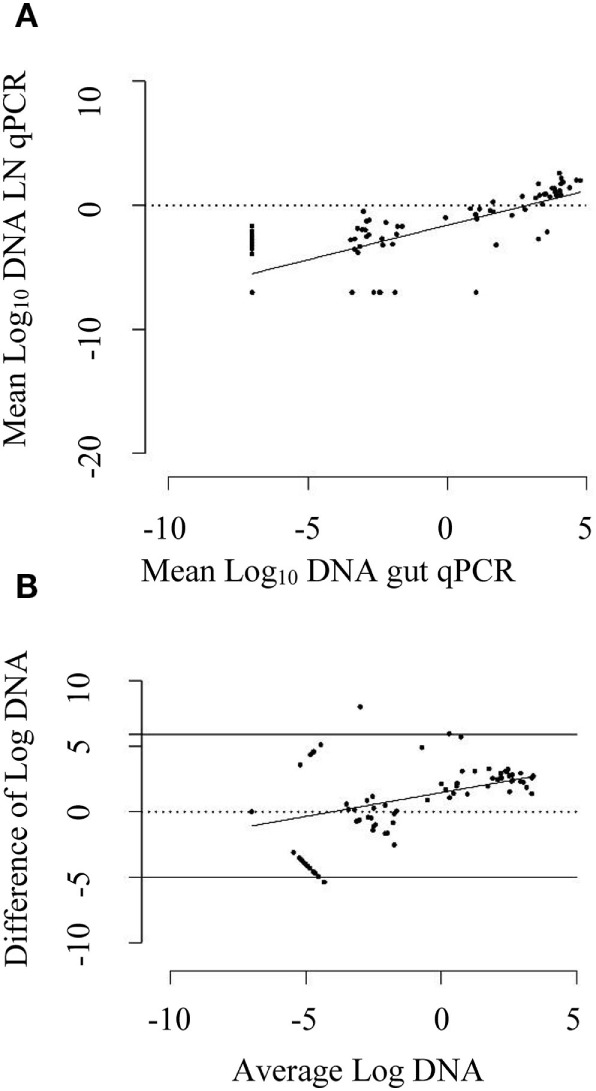
Figure 3.

(A) Scatter plot of mean log10 DNA quantified by mesenteric lymph node (MLN) quantitative PCR (qPCR) against log10 DNA quantified by intestinal tissue (gut) qPCR. The solid line is the regression line. A positive correlation coefficient of 0.78 (95% CI: 0.69, 0.84) was observed. (B) Bland–Altman plot depicting difference of log10 DNA quantified by gut qPCR and MLN qPCR against average log10 DNA quantified by them. The dotted line shows the line of perfect agreement whereas two solid lines show the limit of agreement. The DNA quantified by gut qPCR was 2.94 times higher than that quantified by MLN qPCR for the same animal on an average. The solid line is the regression line of average log10 DNA against difference of log10 DNA. An increase in average difference was observed for the increase in DNA quantity in the gut and MLN homogenate.
