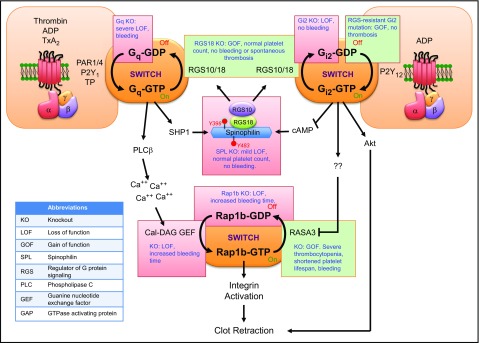
Figure 2.
Integrating the platelet signaling network to obtain an optimal response. Although platelet signaling pathways were originally described one at a time, they form a closely regulated network that both promotes and limits the hemostatic response. The figure focuses on events downstream of the G protein–coupled receptors for thrombin, ADP, and TxA2. It illustrates 2 GTP-dependent switching points or nodes in the network, crosstalk between pathways, and the presence of regulatory loops that affect information flow through the nodes. The green and red boxes summarize transgenic mouse models associated with gain or loss of function, respectively. References are in the text.

