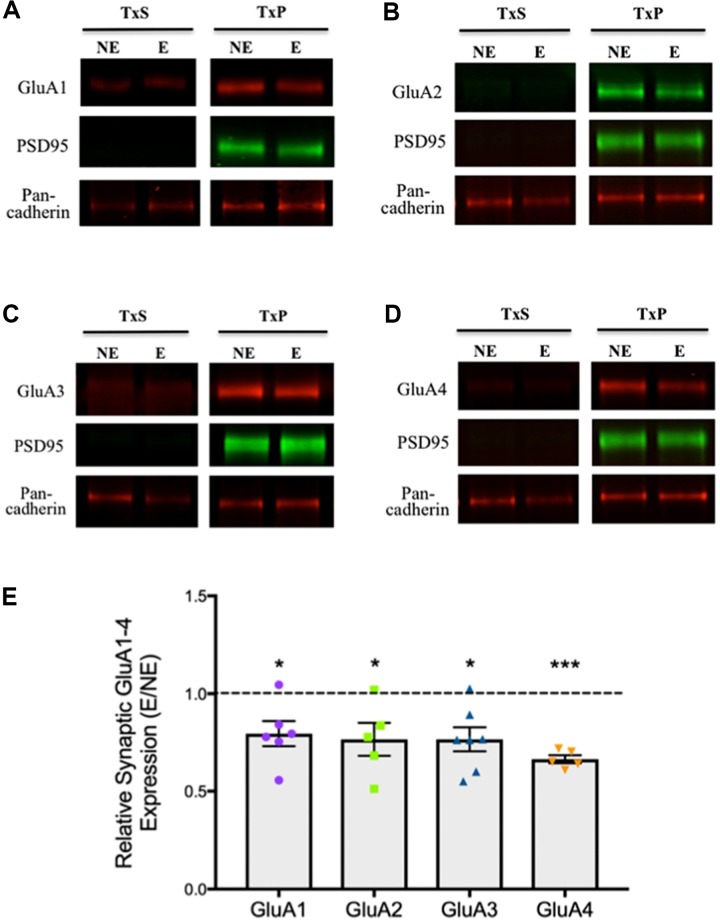
FIGURE 2.
Relative synaptic expression of GluA1–4 in the somatosensory cortex. (A–D) Representative immunoblots showing extrasynaptic and synaptic AMPAR subunit expression; (A) GluA1, (B) GluA2, (C) GluA3 and (D) GluA4, with the loading markers PSD95 and Pan-cadherin. (E) Scatter-plot with bar graphs showing a significant decrease in AMPAR GluA1 (0.79 ± 0.07, n = 6, p < 0.05), GluA2 (0.77 ± 0.08, n = 5, p < 0.05), GluA3 (0.77 ± 0.06, n = 7, p < 0.05), GluA4 (0.66 ± 0.02, n = 5, p < 0.01) expression in stargazer (E) synaptic fractions relative to NE control littermates after normalization against Pan-cadherin. Symbols ‘∗’ indicate p value significant digits (∗p < 0.05, ∗∗∗p < 0.005).

