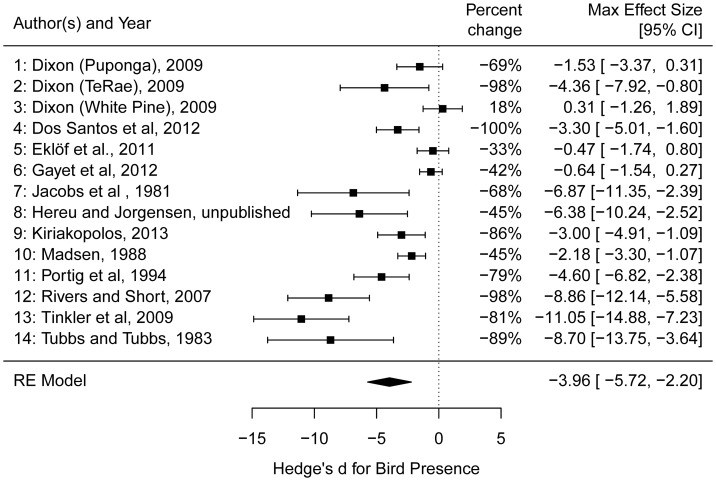
FIGURE 5.
Forest plot of the maximum effect sizes (Hedges’ d) and 95% confidence intervals from the 14 independent measurements from 11 studies used in the top-down analysis. Percent changes of the mean biomass in the absence of birds from the presence of birds is also provided. Dixon (2009) performed experiments at three unique sites and we treated each site as an independent study (site name listed in parentheses). The RE model is the random effects model produced by the rma function in the package metafor and shows the estimate and confidence interval of the overall effect of waterfowl presence on Zostera abundance.

