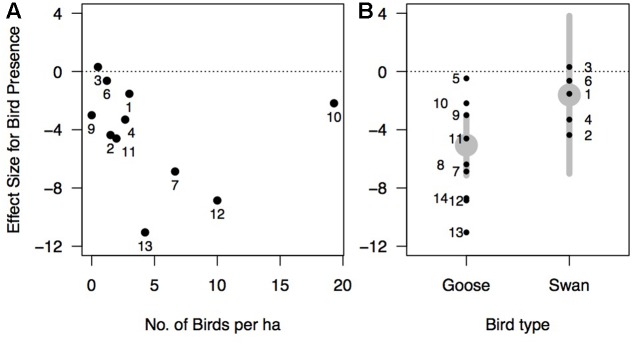
FIGURE 6.
Effect size of waterfowl on eelgrass (Hedges’ d) as a function of: (A) bird density (number of birds per hectare). The model describing this relationship was the most supported in our model set based on Akaike information criterion (Table 2). Note: three studies were excluded because they did not report bird density (Tubbs and Tubbs, 1983; Eklöf et al., 2011; Hereu and Jorgensen unpublished data). (B) Bird type (goose or swan). This model is the second model most supported in our model set (Table 2). Gray points represent the effect size estimated by the model with gray lines showing the 95% confidence interval. In panels (A,B), points are numbered by study as in Figure 5.

