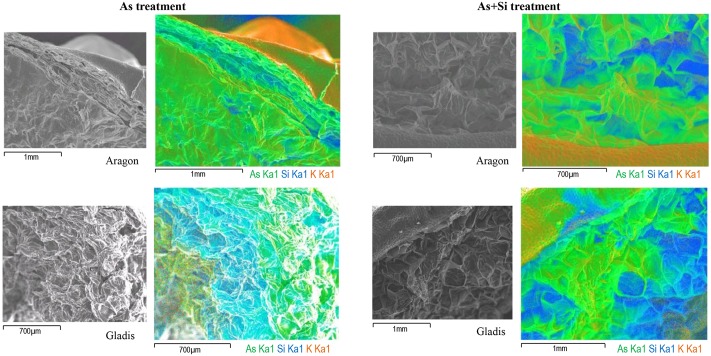
FIGURE 2.
SEM/EDX fruit multi-element distribution maps. Fruit Secondary Electrons (SE) image, As (Kα1), Si (Kα1), K (Kα1) emission X-ray multi-element map, for Aragon (Top) and Gladis (bottom) under As (Left) and As+Si (Right) treatments. The map colors code is: green for As, blue for Si, and orange for K. In SE images black bar at bottom left indicates cross section size.

