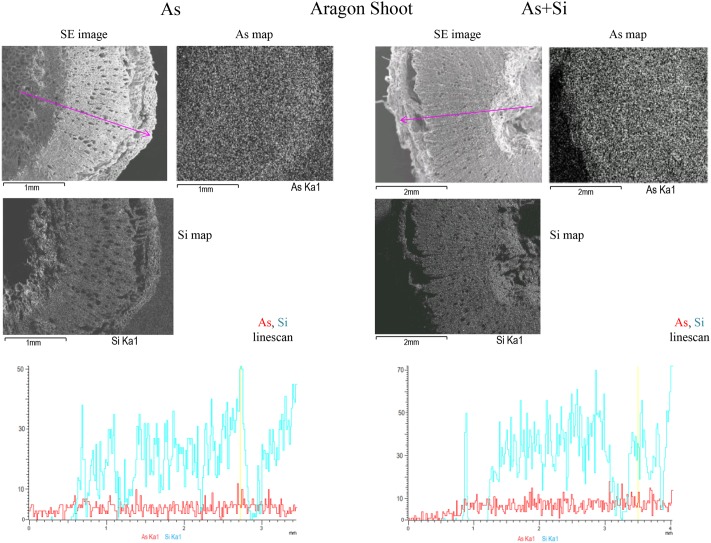
FIGURE 3.
SEM/EDX multi-element distribution maps in Aragon shoots treated with As or As+Si. Shoot Secondary Electrons (SE) image, As (Kα1), Si (Kα1), emission X-ray element distribution maps and As and Si line-scan for relative concentrations for As treatment are on the Left, As+Si on the Right. The maps are in shades of gray: light gray is were elements are more concentrated, dark for lower concentrations. The pink arrow in the SE image indicates the line-scan transect, in line-scans red is for As, blue is for Si. In SE images black bar at bottom left indicates cross section size.

