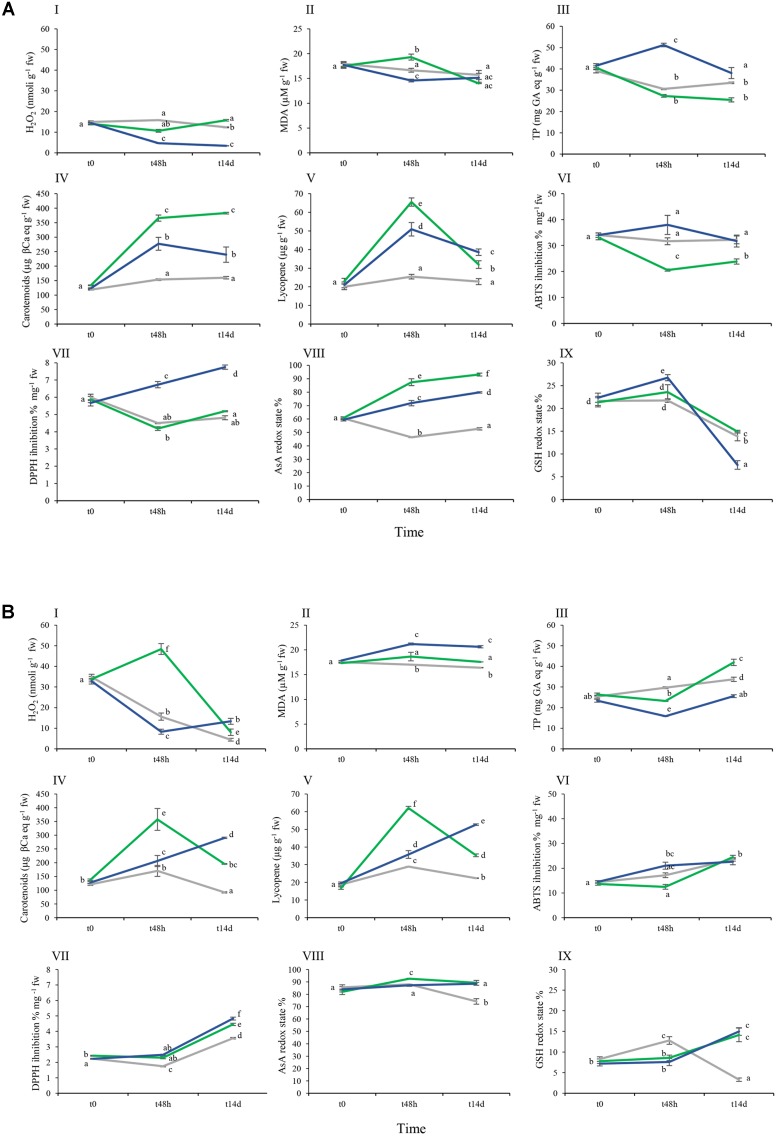
FIGURE 4.
Effect of As and As+Si biochemical parameters in cvs. Aragon (A) and Gladis (B). Lines of different colors are for different treatments: gray: nt, green: As, blue: As+Si. Black vertical bars indicate standard errors (se). Boxes from I–IX: H2O2, MDA, TPs, Carotenoids, Lycopene, ABTS, DPPH, AsA redox state, GSH redox state. Different superscript letters above the standard error (SE) bars indicate significant differences according to ANOVA followed by post hoc Tukey’s HSD test for multiple comparisons analysis (p ≤ 0.01). Values equal to 0 means below detection limit (BDL).

