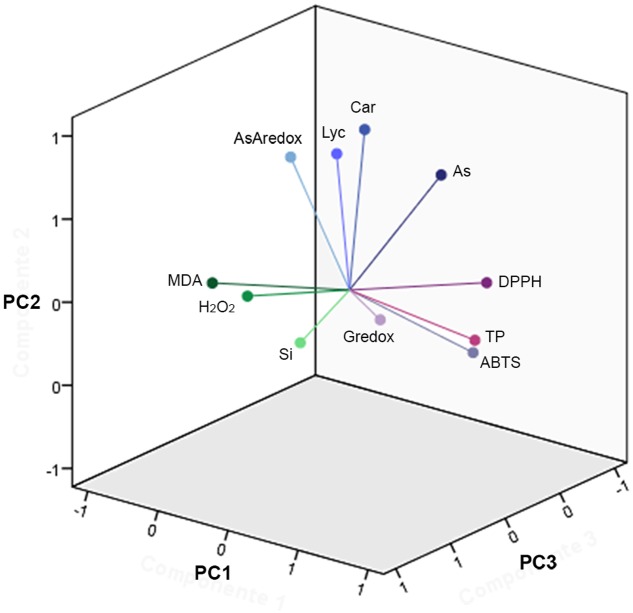
FIGURE 6.
Principal component analysis vectors. Three-dimension (3D) representation of the 11 vectors for the PCA of the fruit for both cultivars, as in Figure 5, utilizing the loading values in Supplementary Table S2. The component extraction criteria were: eigenvalue λ > 1 and varimax (orthogonal) rotation. The total proportion of the overall variance explained (e.v.) was 74.7%. PC1: λ = 3.9, e.v. = 36.0%. PC2: λ = 2.6, e.v. = 23.7%. PC3: λ = 1.7, e.v. = 15.0%. Vectors represent the amount of total variance, for all treatment types and treatment times, apportioned in each parameter.

