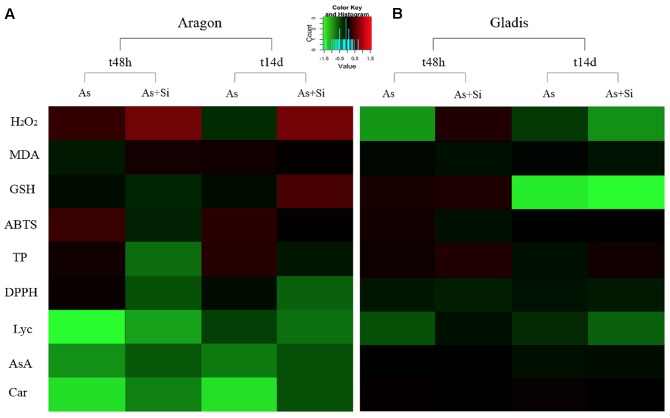
FIGURE 7.
Heat-maps for cv. Aragon (A) and cv. Gladis (B), of each parameter listed on the left. Parameters values were obtained by subtracting from the control (nt) the respective value of the treatment (As or As+Si) either after short-term (t48h) or long-term (t14d) exposure, then normalizing by the nt value. Green: control lower than treatment, red: control higher than treatment, black: equal values.

