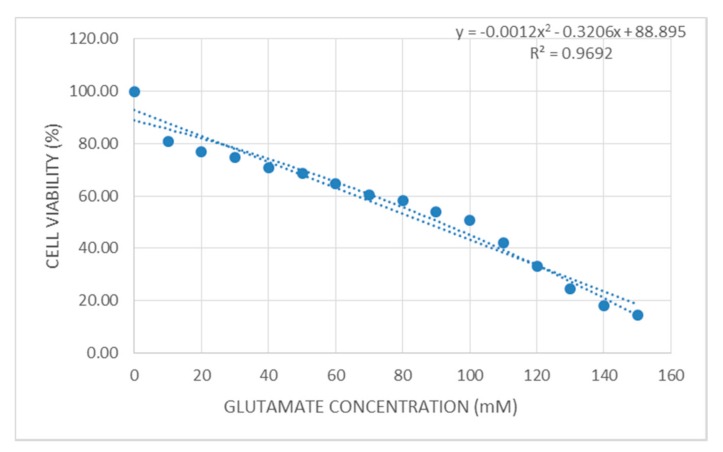
Figure 2.
The effect of various concentrations of glutamate on primary astrocyte cells. Cultures were treated with various concentrations of glutamate for 24 h, y is showing the cell viability, x is showing the glutamate concentration and R2 is showing coefficient of determination. IC20 and IC50 were calculated based on an equation with almost 97% accuracy. The figure shows 80% and 50% cell viability in 10 mM and 100 mM glutamate concentrations, respectively.

