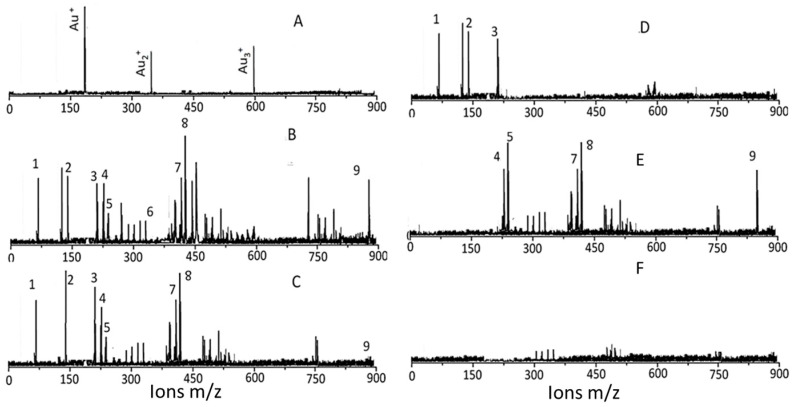
Figure 4.
Mass spectral identification of surface ligands. (A) LMALDI that detects Au ions; (B) typical LDI (matric free) analysis of AuNPKG-50 synthesized by a mixture of kudzu root and gum; (C) typical LDI analysis of a mixture of kudzu and gum solutions; (D) typical LDI (matrix free) analysis of AuNPG-50 synthesized by a gum solution alone; (E) typical LDI (matrix free) analysis of AuNPK-50 synthesized by a kudzu extract alone; and (F) analysis of a blank solution. Peak identification 1: 73 m/z arabinose, galactose, fructose; 2: 147 m/z galactose; 3: 217 arabinose; 4: 225 m/z daidzein; 5: 229 m/z d4-daidzein; 6: 370 m/z not identified; 7: 417 m/z puerarin, 8: 429 not identified; 9: 894 kakkasaponin; Au+ 193 m/z; Au3+ 396 m/z.

