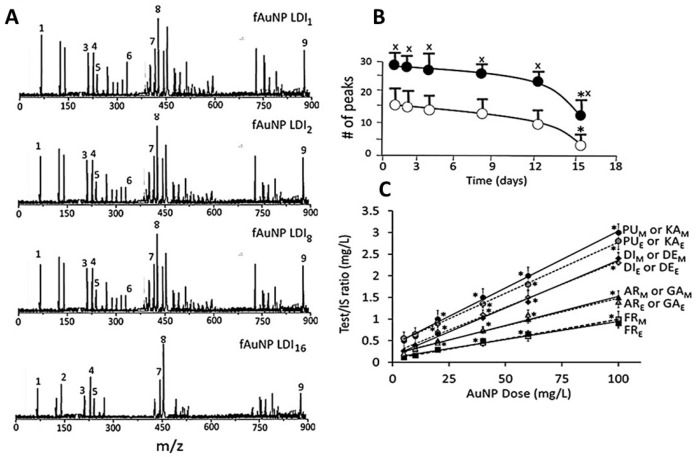
Figure 7.
Identification of surface ligands on AuNPs collected from Ap/En and Ap/Ep cells. (A) the plant component peaks at 1 (fAuNP LDI1), 2 (fAuNP LDI2), 4 (fAuNP LDI4), 8 (fAuNP LDI8), and 16 (fAuNP LDI16) days after ethanol exposure; (B) Time course of change in total number of peaks adsorbed onto the AuNP surface. Total number of peaks decreased significantly at day 16 (filled circle: number of peaks in matrix exposed cells, open circle: number of peaks in ethanol exposed cells). (C) AuNP dose versus (ligand peak/IS peak) ratio plots for surface ligands in matrix exposed (subscript M) and ethanol exposed (subscript E) cells. Abbreviations: PU: puerarin, KA: kakkasaponin, DI: daidzin, DE: daidzein, AR: arabinose, GA: galactose, FR: fructose. Values are mean ± SD. x: p < 0.05 when compared with corresponding open circle values, and *: p < 0.05 when compared with values from same group.

