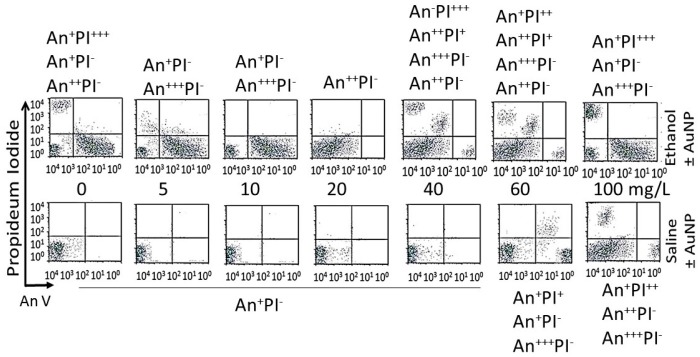
Figure 12.
Effects of different doses of AuNPs on incorporation of annexin V and propidium iodide (PI) in An/En (bottom 0 mg/L), Ap/En (bottom 5 to 100 mg/L), Ap/Ep (top 5 to 100 mg/L AuNP) and An/Ep (top 0 mg/L) cells. Superscripts + to +++ represent relative distribution of An and/or PI positive cells (−: An negative, +: lowest distribution, ++: intermediate distribution and +++: high distribution).

