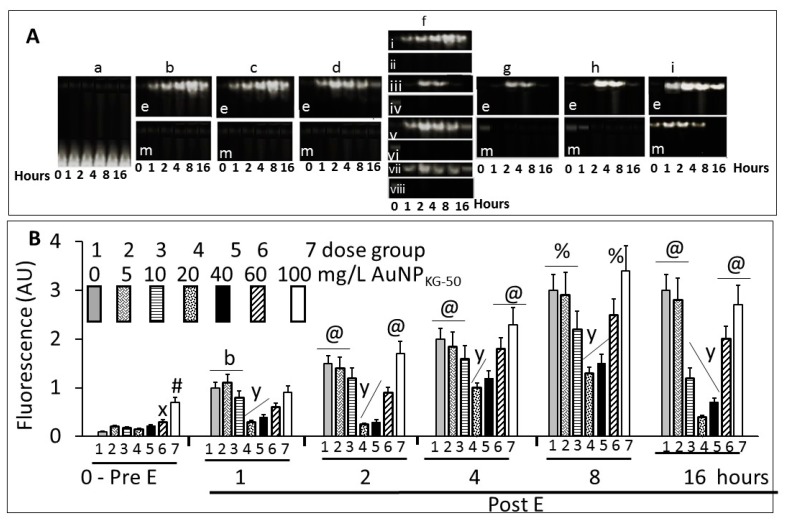
Figure 14.
(A) Typical electrophoretic separation of NFκB dimer, p65–p50, in An/En (matrix), An/Ep (E+matrix), Ap/Ep (E+ 5 to 100 mg/L, data for AuNPKG-50 is shown), and Ap/En (saline + 5 to 100 mg/L, data for AuNPKG-50 is shown) cells. [a] matrix exposed control, An/En cells, [be] AuNP negative but ethanol positive An/Ep cells, [bm] AuNP and ethanol negative An/En cells, [ce] Ap/Ep cells receiving 5 mg/L AuNPKG-50, [cm] Ap/En cells receiving 5 mg/L AuNPKG-50, [de] Ap/Ep cells receiving 10 mg/L AuNPKG-50, [dm] Ap/En cells receiving 10 mg/L AuNPKG-50, [f] Ap/Ep cells receiving 20 mg/L AuNPPEG+K+G (fi), AuNPKG-50, (fiii), AuNPK-50 (fv) and AuNPG-50 (fvii), and [ge, he, ie] Ap/Ep cells receiving 40, 60, and 100 mg/L, respectively, and [gm, hm, im] Ap/En cells receiving 40, 60, and 100 mg/L, respectively; (B) Scan of the p65–p50 fluorescence—dose–response and time course studies. (0 –Pre E) Ap/En cells were exposed to different doses of AuNPKG-50. (1 to 16 days post ethanol exposure): Ap/Ep cells were exposed to different doses of AuNPKG-50 for 4 days then ethanol for 24 h. Cells were analyzed at day 1, day 2, day 4, day 8 and day 16 post ethanol. Values are mean ± SD. x: p < 0.05 when values for cells exposed to 60 mg/L were compared with cells exposed to lower AuNP doses. #: p < 0.05 when values for cells exposed to 100 mg/L were compared with cells exposed to lower AuNP doses. b: p < 0.05 when values for cells exposed to 0, 5, and 10 mg/L were significantly higher than the values for cells exposed to higher doses. y: p < 0.05 when values for cells exposed to 20 and 40 mg/L were compared with other values. @: p < 0.05 when values for same AuNP dose collected at different time intervals were compared. Values are mean ± SD, n = 5.

