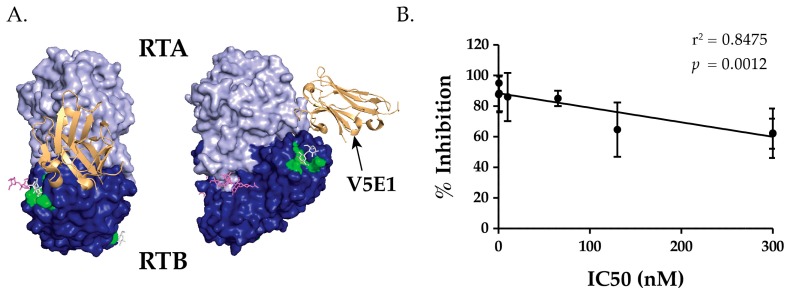
Figure 2.
Relationship between V5E1 competition and toxin-neutralizing activity. (A) The crystal structure of V5E1 (gold) in complex with RTA (light blue) and superimposed on ricin holotoxin (RTB, dark blue), from [24]. RTB’s 2γ Gal/GalNAc binding pocket is colored green; (B) Linear regression analysis of IC50s of Tier I and Tier II VHHs versus competition (% inhibition) with V5E1 (n = 8; r2 = 0.8475; p = 0.0012). Tier III VHHs were not included in this analysis since they did not produce quantifiable IC50s. Each point on the graph represents a VHH. IC50 values are the mean of at least three technical replicates, while % inhibition values are the mean and SD of three technical replicates. Refer to the Material and Methods for additional details.

