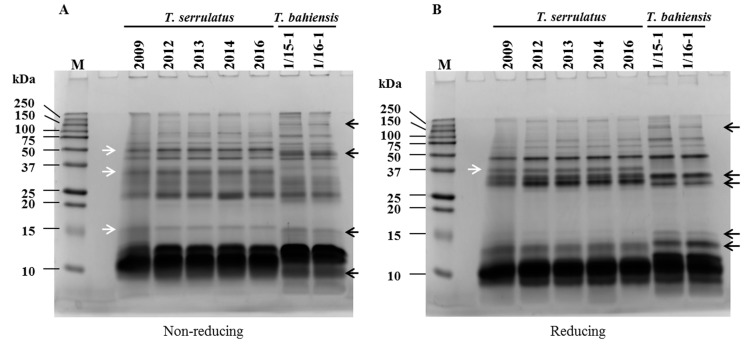
Figure 2.
Comparison of Tityus serrulatus batches by 15% SDS-PAGE in non-reducing (A) and reducing (B) conditions (20 µg of protein/well, Coomassie stain). Arrows indicate visual differences between protein bands of T. serrulatus and T. bahiensis venoms. The numbers above each line indicates the batches used. M: molecular weight marker.

