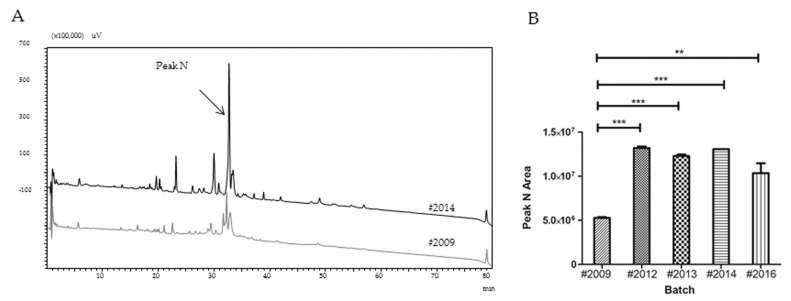
Figure 3.
Comparative profile on reversed-phase chromatography of T. serrulatus (30 μg of protein) batches #2009 and #2014 (A), and the statistical analysis peak N area from all batches (B). The separations were performed at a flow rate of 0.6 mL/min using a C-8 column ACE 3 C8-300 (100 mm × 2.1 mm) and a 10–70% gradient of solvent B (being 0.1% trifluoroacetic acid (TFA) in water, as solvent A, and acetonitrile and solvent A, 9:1, as solvent B) over 70 min. In all cases, elution was followed by the measurement of ultraviolet absorption at 214 nm. One-way ANOVA was used to compare peak N areas and all batches showed statistically significant differences from batch #2009, according to the post-test Tukey’s multiple comparison (** p < 0.01 and *** p < 0.001).

