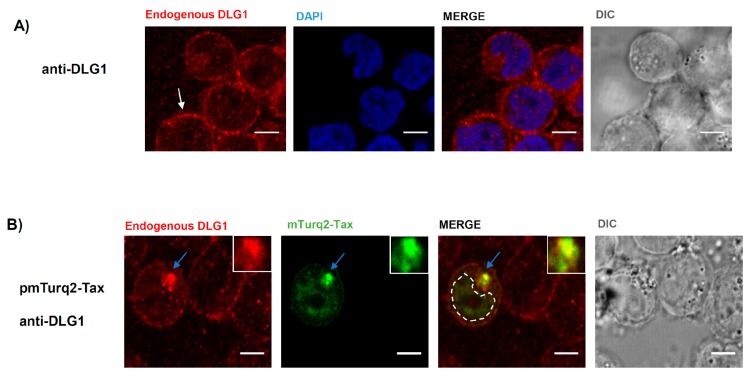
Figure 7.
Tax-mediated alteration of DLG1 expression in T-cells. (A) Analysis of DLG1 expression in Jurkat T cells. The expression of endogenous DLG1 indicated with white arrows was assayed by immunfluorescence using an anti-DLG1 antibody (red). The nucleus was stained with 4′,6-diamidino-2-phenylindole (DAPI) (blue); (B) Expression of DLG1 in the presence of Tax. Jurkat T-cells were transfected with pmTurq2-Tax and endogenous DLG1 expression was assayed by IF. The light blue arrows indicate the co-localization region (yellow) which is amplified in the inset. All scale bars represent 5 µm.

